Bins
Bins devide the total range of wavenumbers into equal size or not-equal sized ranges. Inside the bins, the values of the opacity function can be compacted into a more lightweight format, in order to same memory space. An example is shown in Fig. 6, where the wavenumber range from 0 30000 cm^-1 is divided into fife bins. Inside of each bin, the opacity function is sorted from small to large, and mapped to a new parameter y, rangin from 0 to 1. When the opcity function has empty parts inside or is not ranging to the full bin width, then the sorted opacity function is zero (or kmin, if used) on the lower part.
doResampling = 0
doStoreFullK = 1
doStoreSK = 2
nbins = 5
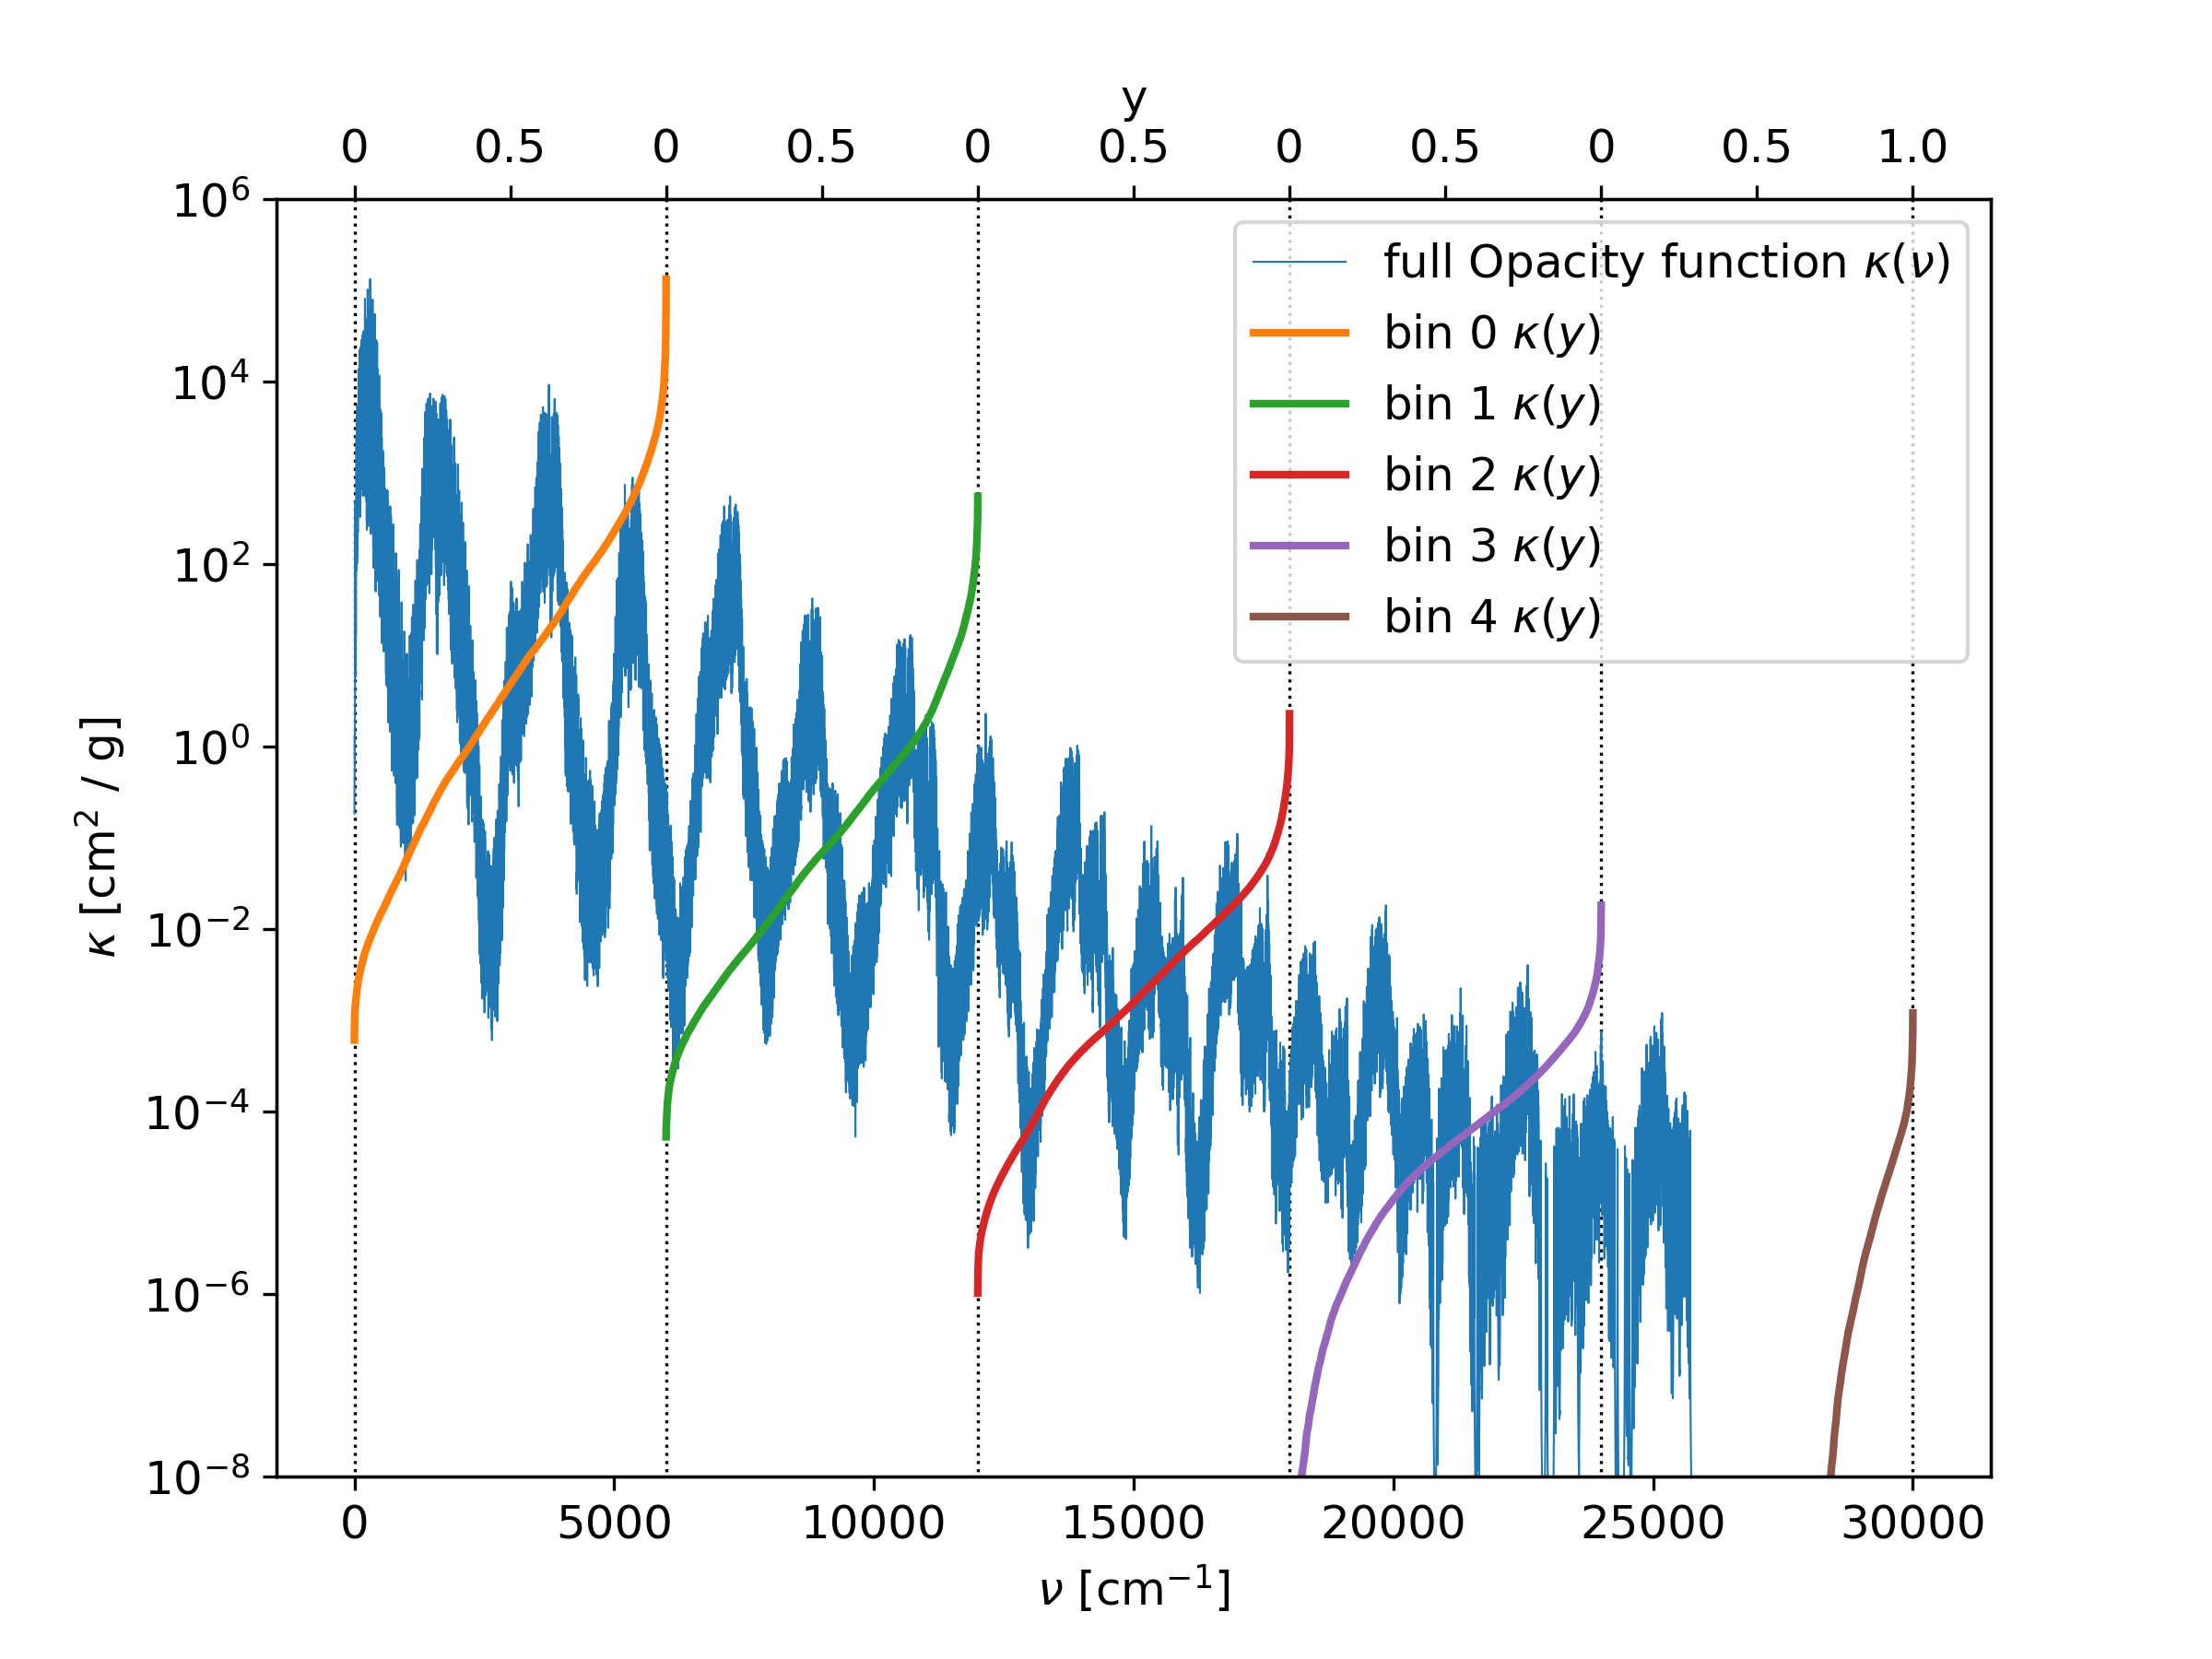
Fig. 6 The opacity function is divided into fife bins. Inside each bin, the opacity function is sorted and mapped to a new paramter y, ranging from 0 to 1.
Using a binsfile
When a binsFile name is given in the param.dat file, then this
file is used to generate the boundaries of the bins. The bins do not have
to be equal sized.
| Note that this option does not support the doResampling and
doTransmission options.
| The binsfile must contain line by line the boundaries of the bins in cm^-1.
An example of a binsFile is given below, and the result is shown in Fig. 7.
bins.dat:
2000
6000
12000
15000
25000
30000
doResampling = 0
doStoreFullK = 1
doStoreSK = 2
binsFile = bins.dat
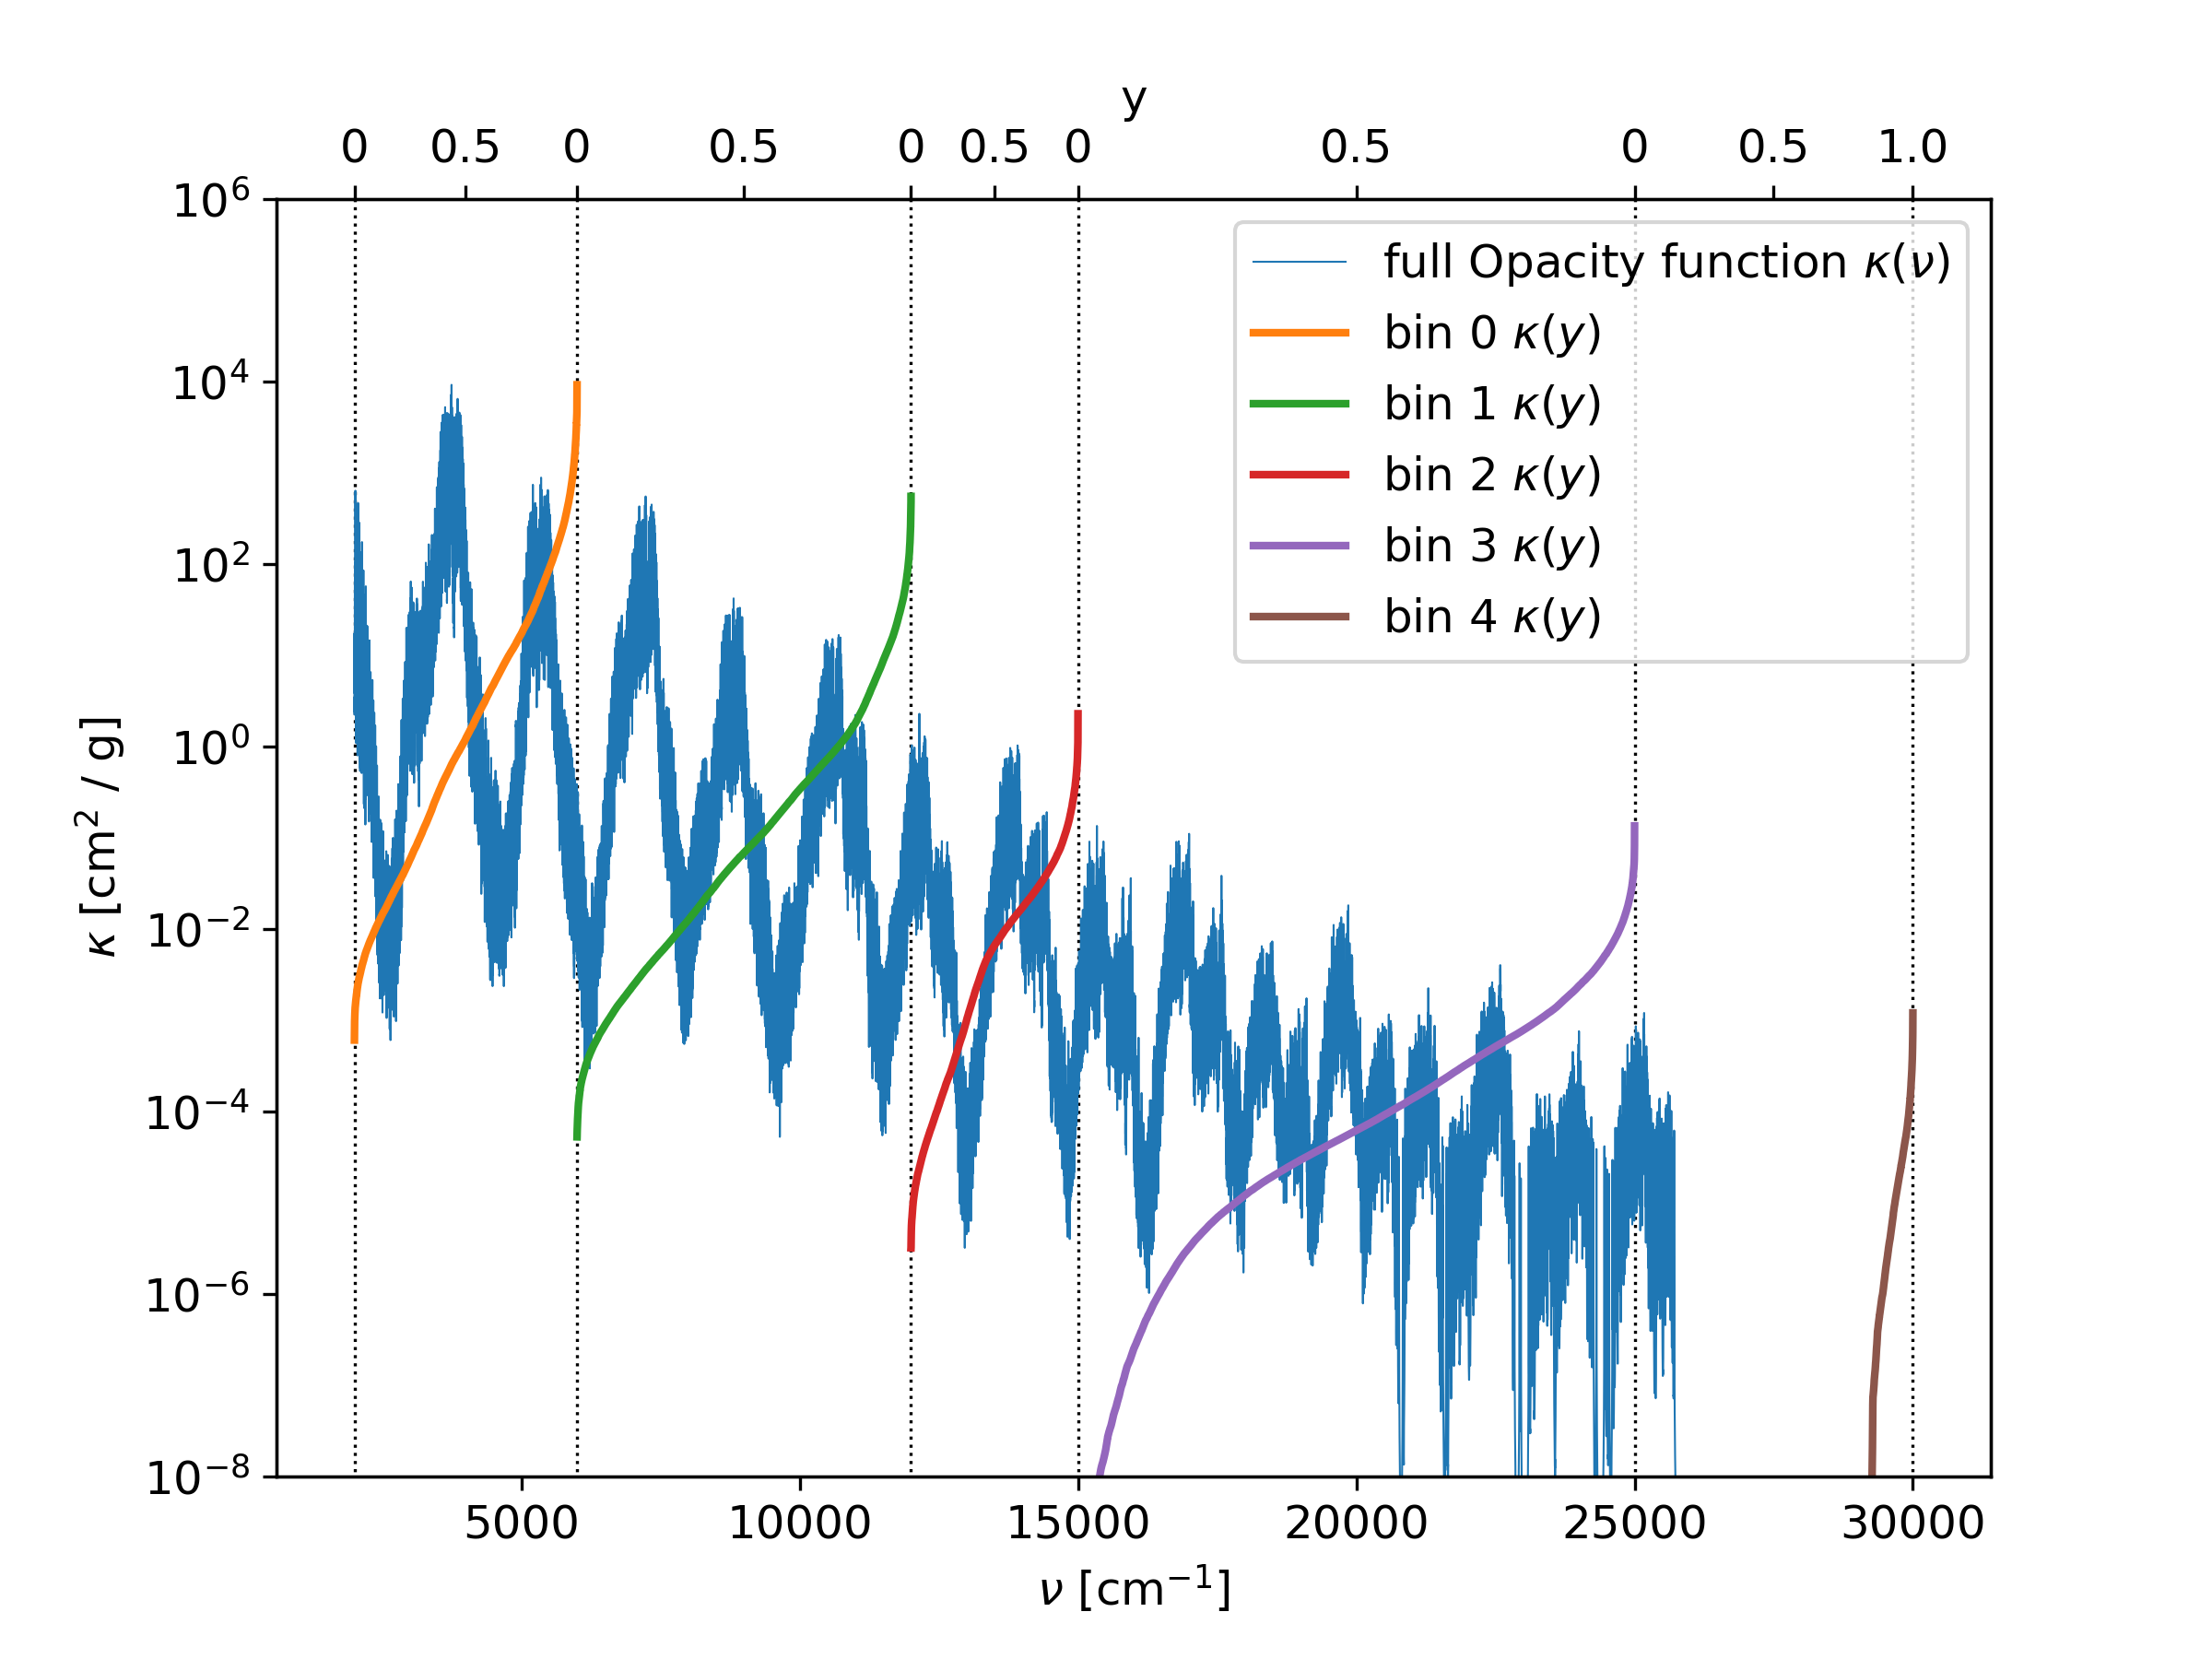
Fig. 7 The opacity function is divided into fife bins, according to the entries of the binsfile. Inside each bin, the opacity function is sorted and mapped to a new paramter y, ranging from 0 to 1.
The output edges option
Instead of writing the -per bin sorted- opacity function with the full resolution in
wavenumbers, it is possible to print only averaged positions within the bins.
For doing that, the outputedgesFile option in the param.dat file can be used.
In that file, the edges of the averaged regions within a bin can be specified.
The output possition of the sorted opacity function is then exaclty in between of the
edges. The edges must have values between 0 and 1.
An example of a outputedgesFile is given below, and the result is shown in
Fig. 8. Note that the figure is plotted in log scale, therefore
the averaged points can appear to have too high values.
edges.dat:
0.0
0.1
0.45
0.78
1.0
doResampling = 0
doStoreFullK = 1
doStoreSK = 2
nbins = 5
OutputEdgesFile = edges.dat

Fig. 8 The opacity function is divided into fife bins. Inside each bin, the opacity function is sorted and mapped to a new paramter y, ranging from 0 to 1. The sorted opacity function is averaged within the given edges.